Fourier Studies[WIP]
Personal research in order to understand the Fourier Transform, in particular the Discrete Fourier Transform.
[2008]
Intro
Some time ago, circa 2008, when I was just getting into programming I was also doing a lot of stuff with audio, mainly music production. I became very intrigued by some audio analysis tools, in particular with Melodyne as it was able to decompose polyphonic signals into its musical notes and let you modify each note individually. I wanted to understand how computers were able to detect each note of an instrument with all the harmonics that conform it. The first and almost obvious thing to do was to “play” with the Fast Fourier Transform. By that time I was learning to code using Processing and I did a lot of experiments and visualizations dealing with FFTs. It was fun and I learned a lot, both about programming, audio analysis and FFTs. I even made my own FFT class from scratch, just looking at the maths involved (of course there are already a big bunch of FFT implementations, probably done much better that what I did, but this was for a learning purpose).
FFTs and Musical Notes
Quite soon after I began to play with FFTs I realized that these transforms were not giving me musically relevant information, I was not able to “see” musical notes on the output of the FFT. The linear spacing of the FFT output does not work well with the logarithmic one of musical notes. This is, linear means that every element of the FFT output is spaced by the same amount of hertz. On the other hand, musical notes are spaced logarithmically, the easiest way to understand this is by the fact that for each octave (one note and the following one with the same name) you multiply the frequency by a factor of two. For example, the note A5 is 440Hz, then A6 = 880Hz, A7 = 1660Hz and so on. You can easily see that the amount of Hertz (Hz) that space each octave is not the same.
TODO: add image> linear spacing vs log spacing and notes.
Linear to Logarithmic
As my interest had to do with musical notes I wanted to have the FFT in a musical scale. Almost always the FFT results are visually displayed using a linear to log spacing, in order to make it more musical, but this means that you have very little information spread across several octaves of the lower, bass range, which happens to be very musically relevant and on the other hand you have an excessive amount of information in the higher, treble range, which at the end happens to be not really useful; having much less will probably provide the same relevant information. If you want to get more resolution on the bass end you need to make your FFT larger, which means more processing power and less time resolution.
TODO:add spectrogram image with annotations.
Something Not Nice
As you try to increase the frequency (spectral) resolution of the Discrete Fourier Transform, hence the FFT, by increasing the number of samples needed to perform it (which is called the size of the transform) the the timing resolution decreases. And on the opposite direction, if you wanted a higher time resolution the spectral resolution went down. This is actually a problem that the Fourier Transform faces and it has to do with the uncertainty principle. So this is sort of a dead end. You cant get both, at least with the standard DFT and FFT.
First shot: Constant Q Transform
As I was researching over the www, I found out the Constant Q transform, and an interesting paper about an efficient implementation of it. I wasn’t able to find any useful implementation of it, at least for me. I just found a MatLab implementation, so I decided to code my own implementation for processing using the aforementioned paper and the MatLab implementation as reference. Once done I published the resulting implementation on Google Code (now it is hosted on my Github account as Google Code is closing. ) At first it worked, quite well actually.
Constant Q explained
The constant Q is actually a quite fancy algorithm, but the idea behind it is quite simple.
So, if you want more resolution on the lower bins of the FFT and discard some of the excessive information on the higher end to make it more musical. Why not just average the information that corresponds to each musical note or in a logarithmic fashion? Then, how do you make this average? This is the fancy part of the Constant Q. For each bin that you define for the Constant Q (it can be less than a musical note, say 3 bins per musical note) you need perform a weighted average the FFT’s bins that correspond to the frequencies of each bin, thus, you need to define these weights. To do such, the weights for each bin averages are defined by a cosine bell curve adjusted so it overlaps nicely with the its neighbor bins, so no info is “lost”. Performing this calculations can become very intensive if you just implement straight forwards. So here comes into the game the fancy method that the aforementioned paper described. I will not go further into it, as it is very well explained there. The calculation of the averaging weights is done once, when de parameters of the Constant Q are defined. The problem here comes when you want to get bins further down in frequency, thus musical notes, as the FFT needed grows bigger and bigger, and it grows quite fast. At the end the uncertainty problem described before gets worse. :(
TODO: Image> weighting averages Image> FFT Size versus bass range
I tried out several method to overcome this problem, like doing several CQ transforms with different ranges and mixing them up, overlap the samples used, but at the end it means a lot of processing power and, worse, a lot of wasted calculations, as these are being discarded by all the averaging being done.
I felt like hitting a dead end. But, how does this happen in our brains as we are able to detect sound frequencies, notes, different instruments and timbres with an incredible resolution, both temporal and spectral? How did some sound analysis software seemed to overcome this sort of dead end? There must be something missing or something I haven’t understood yet or some obscure knowledge just revealed to a few…
However, I decided to leave this research in stand by, yet it was immensely educational and fun. I almost forgot about it until this year (2015).
[2015]
Google code and the Constant Q
As said before, I published the Constant Q Transform implementation I did for Processing on Google Code.
Earlier this year Google announced that it would close the Google Code services as there were other better and more popular alternatives like Github, and it offerer the possibility to automatically move your repos into a Github account. So, I made them do so, and as a consequence the whole Constant Q Transform came back into my mind, yet I the passing years I acquired a lot of knowledge relevant to the subject.
Hello openFrameworks
As my programming needs and knowledge grew, the Processing environment fell short. I found out that I was not the only one with similar needs and that several of the others with these needs begun another coding platform (the correct word should be toolkit) similar to Processing in its use and philosophy but largely more powerful, name openFrameworks.. I ditched Processing quite fast in favor of openFrameworks, and became an active user, contributing in its forum, providing code for its core and writing several addons for it. As such I decided to translate the Constant Q Transform implementation made for processing into an addon for openFrameworks. Found here. (I had a much cleaner implementation done but lost it on a hard drive wreck, i’ll rewrite it and publish as soon as I can.)
Inside the Fourier Transform
For the Processing version of the Constant Q Transform I used a custom class for the FFT based on the code of the Minim library. While I was implementing it in C++ for using it with openFrameworks, I decided to go through it’s maths again. It was then when I realized about how the Fourier Transform works internally: it is really simple and easy to understand.
According to Fourier, any waveform is formed just from superimposed sine waves of different frequencies, phases, durations and magnitudes. Thus, you can decompose any waveform it into all of the sine waves that form it (which happens to be kind of impossible for complex signals like music), so at least you can try to look for the presence of certain sine waves at fixed frequencies.
Finding waves frequencies
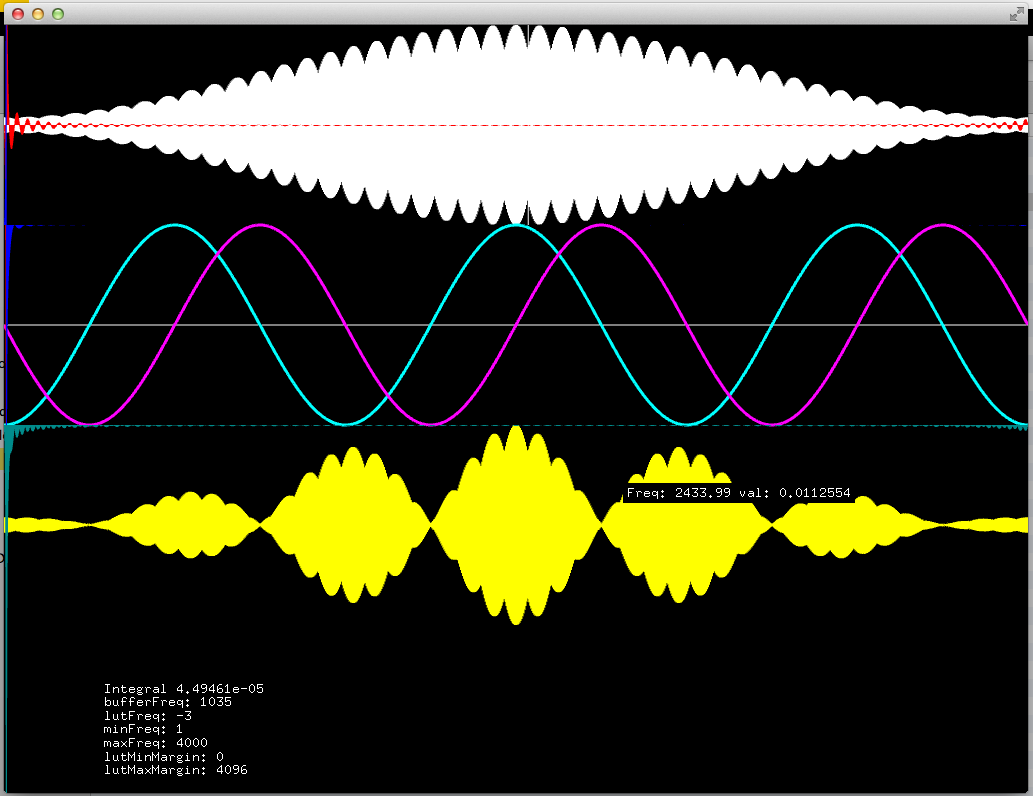
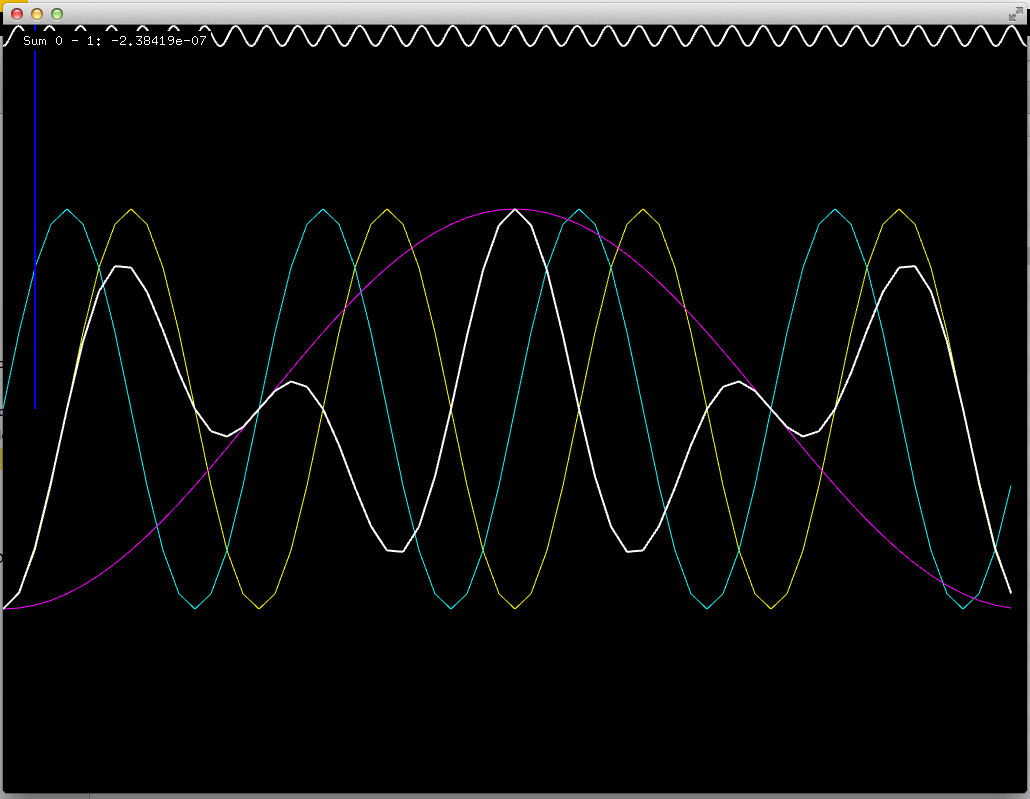
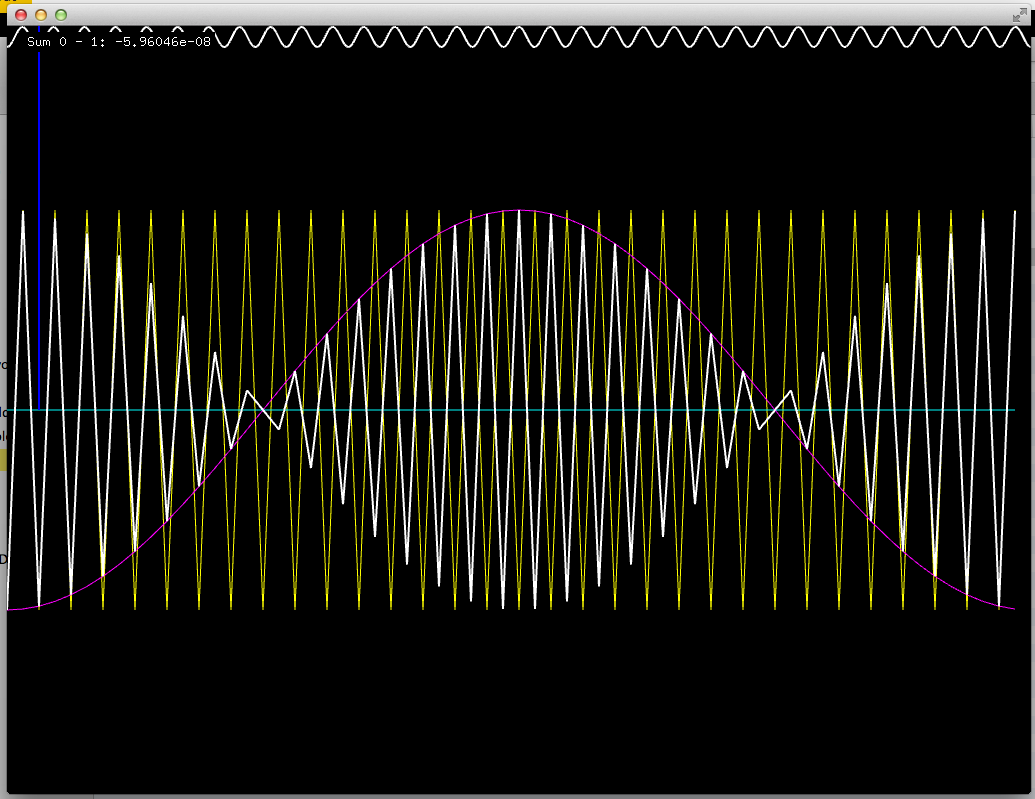
So, checking any given waveform for the presence of a certain frequency is quite simple. Just compare the waveform you have with a sinusoidal wave with the frequency that you are looking for. Mathematically this is also simple, you just need to multiply each value of the waveform with the according value of the sinusoidal wave and sum all the results. The result will indicate the amount of the searched frequency in the analyzed signal.
Phase
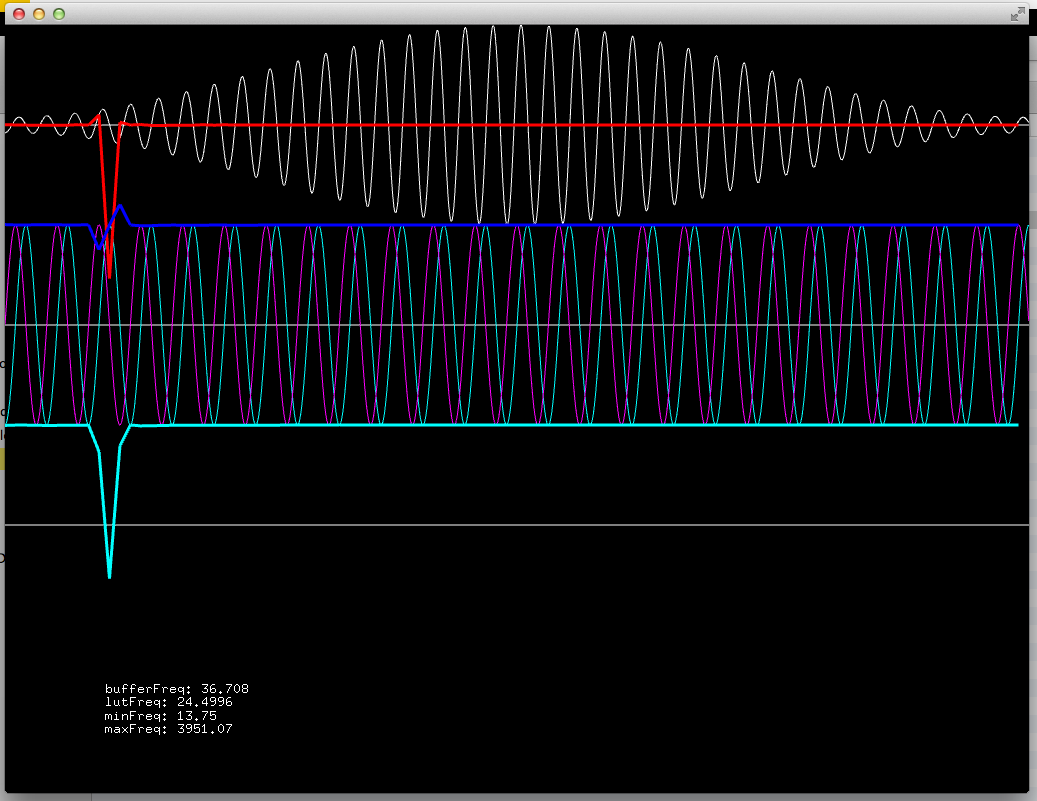
It might happen that the analyzed wave and the sinusoidal wave are displaced, or do not start at the same point, so when multiplying and summing all up the result might not be the same as if these were aligned or “in phase”. To deal with this a second sinusoidal wave is used. This second one is 1/4 cycle displaced in respect to the first one. Actually the first one is produced by the cosine function and the second one by the sine function. The same thing is done with this new wave as it was done with the first one, just multiply and add with the analyzed wave. In this case the value that this operation gives is called the phase. In order to get the real magnitude of the sought out frequency in the analyzed wave the square root of the addition of the square of each resulting value. Just like solving the hypothenuse in the Pythagoras theorem.
There are a lot of analogies with spinning discs to exemplify this, but I think that it gets a bit more confusing.
…to be continued.